Closed Enrollment
Published Course
ReCon Water Fundamentals for Food Operations
ReCon Water Fundamentals for Food Operations
Course Created in Partnership with:
About this Course
ReCon Water Fundamentals is targeted to ReCon regional leaders, ReCon site leaders, Process Improvement Engineer (PIE) as well as to any engineering/project managers. PepsiCo started on its journey to transform the way we do business so that we can deliver strong financial returns in a way that is responsive to the needs of the world around us. This class will allow the participants to better understand the basics of water supply, sources and flow. Participants will also learn the importance of measuring and tracking water uses, as well as, the hidden costs of water. Several simple but impactful water reduction tactics to help reduce water consumption will be also shared. Finally, several ReCon tools such as a True Water Costs calculator, the Global Sustainability Dashboard as well as a Plant Water Profiler will be explained. All these tools will help ReCon leaders better identify opportunities, which will support the company’s climate prioritization efforts.
Course Features
-
100% Online
Accessible from any device
-
Self Directed
Learn with a cohort but when it fits in your schedule
-
On-demand Video
Interactive video lessons
-
Beginner Level
No prior experience required
-
PepsiCo Internal Expertise
Brought to you by Global Sustainability Operations
What You Will Learn
- The hidden costs of water
- Why water is important for PepsiCo and for communities where we operate
- How to calculate the true costs of water
- How to compare your site with others
- Simple but impactful actions to reduce water consumption
- How to establish plant priorities
Course Overview
7 Lessons
29 Activities
3 Discussions
2 Live Events
Welcome
-
Kick Off
-
Attend: Kick Off Call
-
Join this kickoff call to learn about:
- Introduction to the CorpU platform and how it works
- Overview of this sprint and how it fits into the stages long term
- Description of final assignment
- Open-ended poll or discussion: What's the most recent thing your plant has done for resource conservation?
-
ReCon Fundamentals - Water for Food
-
Introduction
-
Read: Welcome to Fundamentals
-Welcome to Fundamentals! In this course you'll take a much closer look at how water is used in your plant, where it comes from, what you can do for sustainability, how you can decrease use, and the many reasons why water conservation is so important. You'll watch some fun videos and learn much more about this valuable resource. You will complete the Water Calculation tool, which shows you how you're using water in your plant, and the Water Profiler, a critical spreadsheet that helps you determine the conservation actions with the biggest impacts. You will complete the calculation tool and the profiler and turn them in as part of this course.
-
Complete or Update: Your Profile
-If you haven't previously, please take a few minutes to upload your picture and bio so everyone can start getting to know you. Make sure you include your current role, plant, and any hobbies. It's time to get creative.
If you completed your profile earlier, take a quick look and see if there is anything you'd like to update.
-
Reflect: Your Water Footprint
-Have you ever stopped to think about exactly how much water you use every day? Most people have no idea of all the things that go into their water use, including virtual water use. It's not just the cost of the water—it's so much more.
Understanding your personal water use is the first step in understanding the elements that figure into water use at your plant. Answer some easy questions using this calculator and get an estimate of your use and some handy tips to reduce your personal water footprint.
Complete the Water Footprint Calculator using this link. When you've completed it (it will open in a new window), return to this page. Take a moment to jot down your results and what you discovered along the way.
-
Read: The Basics of Water Supply and Sources
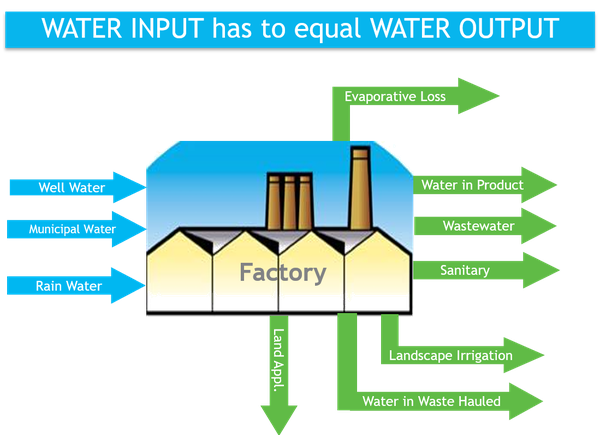
-All the water that enters the plant has to exit one way or another. Water may come from onsite wells, a municipal utility, or rainwater harvesting. Water exits the plant by ending up in the plant’s product, through evaporation, as wastewater, or in other forms.
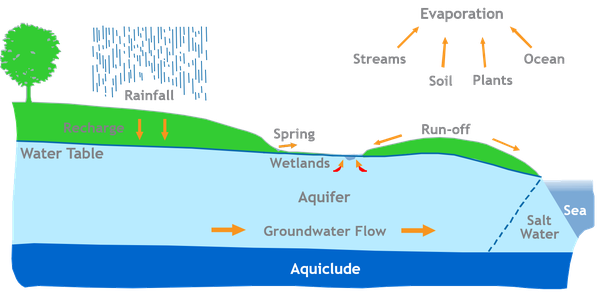
Where does water come from? The water that is available now is the same water that has been on Earth for millions of years. It is constantly recycled through the steps of the hydrologic cycle:
- Evaporation, transpiration, and sublimation (where water moves from the ground to the atmosphere)
- Precipitation (where water in the air falls back to the earth)
As it is recycled, there are many natural purification mechanisms, but there are also many ways for this water to pick up impurities as it travels.
In addition to reducing the volume of water used, we want to reduce the money being spent to clean it up. Water is often viewed as being inexpensive, but when you account for chemicals, system loss, sewer, and energy, it might cost more than you expect.
-
Watch: Watershed
-You just learned about the hydrologic cycle and that water is continuously recycled. Watersheds are a critical part of this cycle because they impact the quality of water draining into streams, rivers, and oceans. Watch this internal video about what a watershed is and how it works.
-
Review: PepsiCo ESG Topics Water Page
-Now that you know more about where water comes from, it's time to take a look at sustainability from the PepsiCo perspective.
This website addresses in detail the broad range of sustainability-related topics that matter to our business and our key stakeholders. Once you've reviewed this information, return to this page and mark yourself complete.
ESG stands for Environmental, Social and Governance.
-
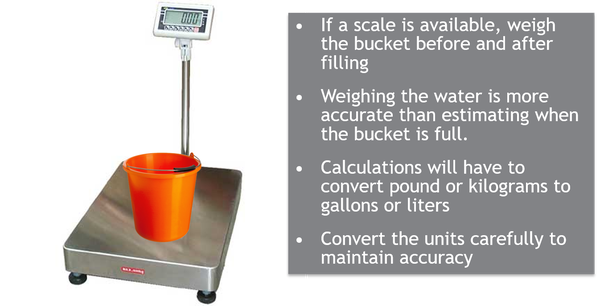
Read: Measuring Water Flow
-Accurate measurement of water is important, not only so you know how much is being used, but as a way to determine how much is being saved. This can be accomplished through a variety of water meters as well as some lower-tech solutions.
Meters, examples, and applications:
- Displacement Meters – Low flow situations where high pressure drop is not an issue and low cost is desirable. Example: flow to an individual piece of equipment such as a shell washer or peeler.
- Velocity Meters – Turbine, Venturi, Orifice, Vortex – Low to high flow, works best with clean liquids, higher cost, accurate, long-time standard meters for pipeline flow. Example: main inlet pipe to a plant.
- Velocity Meters – Magnetic, Ultrasonic – Works well with dirty or clean liquids, higher cost, accurate. Examples: main feed pipes to plant or process.
- Mass Flow Meters – Coriolis Meter – High cost, accurate, slurry or clean fluids, not available in larger sizes. Examples: process batching flow, measuring raw materials into a process stream.
Meters cost money, and may or may not be in your budget. What can you do right now to determine water flow? It's easy!
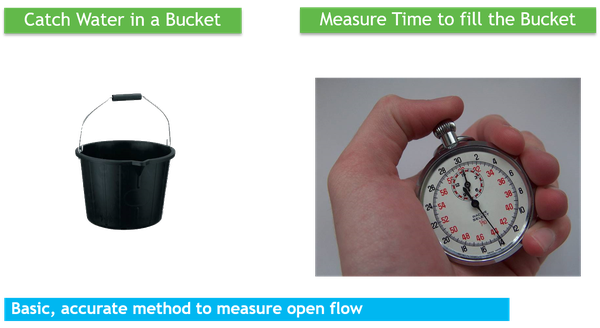
Need to be a little more accurate? Try this:
-
Watch: Sustainability Dashboard and Global Dashboard Tabs
-In this video and following ones, you will look at the Sustainability Dashboard. Look at PepsiCo’s progress towards its objectives, see how your sector supports this effort, and, finally, compare your site to similar ones across the company.
Data is directly pulled from myEHS. The information displayed on the dashboard is used across PepsiCo to assess sector performance, compare sites, and contribute to our external reporting initiatives. Therefore, the plant information entered in myEHS must be as timely and accurate as possible.
This dashboard is no longer updated, however, it is a good example of how information was relayed to the rest of the business. Most sectors have a digital platform where performance is displayed. Contact your Sector sustainability teams for access to the digital platforms.
Notes:
If you have recently taken another Fundamentals course, this may be a repeat. Feel free to skip the video and mark this activity complete.
-
Watch: Sustainability – Water Tab
-In this video, Albert reviews the Water Tab on the Sustainability Dashboard.
In the Water Tab, you’ll see the water intensity by snack and by beverage for the current year, prior year, and baseline performance. You can also see overall improvement and set filters for more specific details about how certain sectors, regions, and locations are performing.
This dashboard is no longer updated, however, it is a good example of how information was relayed to the rest of the business. Most sectors have a digital platform where performance is displayed. Contact your Sector sustainability teams for access to the digital platforms.
-
Watch: Sustainability – Intensity Dashboard and Map Dashboard Tabs
-In this video, Albert takes a look at the Intensity Dashboard and Map Dashboard tabs. Be sure to explore the dashboard regularly to see where your sector and plant perform.
-
Watch: Everyday Water Use
-Watch this video to see how much water it really takes to make your morning latte.
-
Discuss: How Much Does Water Really Cost?
-You've learned that water costs more than the water itself. Think about the video you watched about the water use in your morning latte, and how that concept can apply to your plant.
In addition to the cost of the actual water, in what other ways does water use cost your plant? Use the discussion to work with your colleagues and identify as many different costs as possible.
-
-
Hidden Costs and Avoid/Reduce Usage
-
Read: Hidden Water Use
-As you learned from the Everyday Water Use video, there is much more to the true cost of water than the actual water.
The key is to differentiate what we think we pay (the water cost) vs. what we actually pay (the additional water-related costs that are usually hidden as energy, maintenance, or chemical costs).
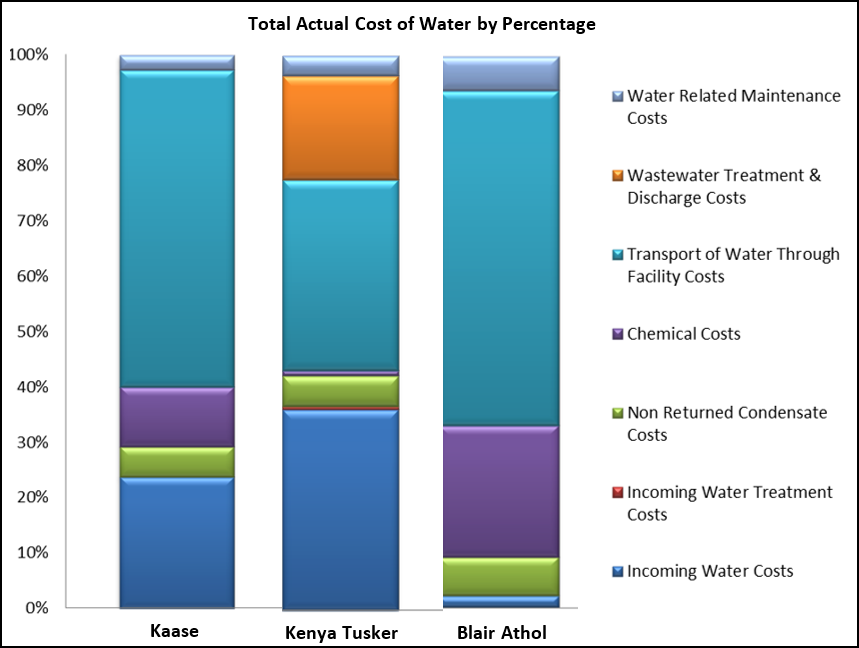
Some of the elements involved in the actual cost of water include:
- Treatment and chemical costs
- Energy – electrical and thermal costs (heating, cooling, and transport)
- Wastewater discharge costs
- Permit and regulatory management
- Equipment and infrastructure maintenance
Below is a graph that provides an overview of the water cost elements between three facilities. Pay special attention to the large teal areas. You can see here that the water cost profile could vary significantly from one facility to another and that most of the time the incoming water cost is just a fraction of the total water costs.
-
Reflect: Actual Cost of Water
-In the space below, note any surprises you found as you read and watched the material on the actual cost of water. What are some of the cost categories in your plant that should be factored into your actual cost of water?
-
Watch: Using the Water Calculation Tool
-Watch this video by Jean-François Allard, Sustainability Senior Manager, Global Sustainability Operations, to see a demonstration of the Actual Costs of Water Calculation Tool, available and attached below (open as Excel spreadsheet).
Also attached below are additional instructions and information for filling out your own Water Calculation Tool.
-
Read: Avoid and Reduce Water Use
-Below are some suggestions to avoid and reduce water use. How many of these ideas can you implement in your plants?
Some common best practices that don't require significant investment and could immediately have an impact on water consumption:
- Run the production line according to recommended specifications. (Many people overuse water thinking it might improve quality.)
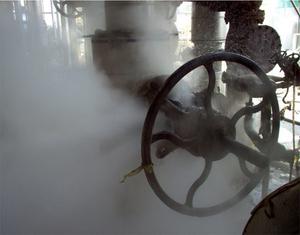
- Implement a solid leak detection and remediation program – water, steam, condensate.
- Implement effective line start-up and shut-down procedures. (Idling equipment requires unnecessary use of resources.)
- Reduce finished product waste.
- Assess and replace worn out spray nozzles.
- Use low water flow spray guns for sanitation.
Avoid using water wherever possible.
- Use brooms and squeegees before rinsing with water.
- Dry clean vessels.
- Change production methods to avoid water usage such as product spills requiring wet cleaning.
- Install solenoid valves and timers to control water.
- Replace water-based conveyors with mechanical.
- Replace water cooling with air cooling.
- Air rinse containers rather than water rinse.
- Replace water ring vacuum pumps with dry pumps.
Reduce water usage wherever possible.
- Install water nozzles where uncontrolled water flow is used.
- Reduce nozzle orifice size as possible.
- Automate manual water usage controls.
- Utilize Clean-In-Place (CIP) technology for previous manual cleaning (snack plants).
- Improve the water efficiency for existing CIP systems.
- Use cleaning chemicals to reduce water consumption.
- Close loop or partially recover water from Liquid Ring Vacuum pumps.
- Eliminate once-through cooling applications.
- Eliminate leaks or overflow from evaporative cooling towers.
- Retrofit toilet facilities with low water fixtures.
- Recover steam condensate.
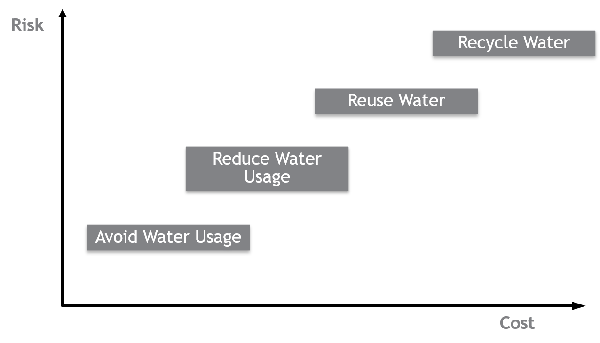
Other ways to reduce water use may include reusing water from one process to another with little or no treatment and recycling water (capturing, treating, and returning the water to the starting point). These two methods require permissions, permits, capital expenditures, and studies before they can be implemented – if they can be implemented. You can learn more about water governance here.
As you are determining the actions you can take to avoid and reduce water use, keep the Cost vs. Risk Hierarchy (below) in mind and begin with the low cost/low risk opportunities.
- Run the production line according to recommended specifications. (Many people overuse water thinking it might improve quality.)
-
Watch: Think and Drink Water – Systems Thinking
-Watch this video, which talks about water as a finite resource.
Think & Drink Water - Systems Thinking (Australia) from WaterSecure on Vimeo.
-
Read: A Good Rule
-No product flowing = no water running!
-
Watch: PepsiCo Innovation - Splash Cone
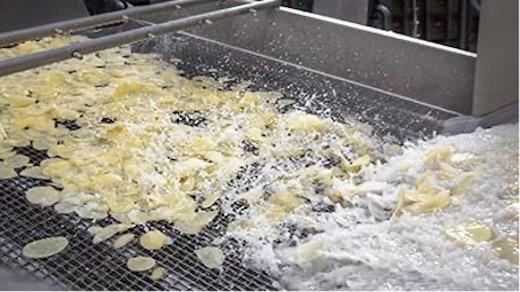
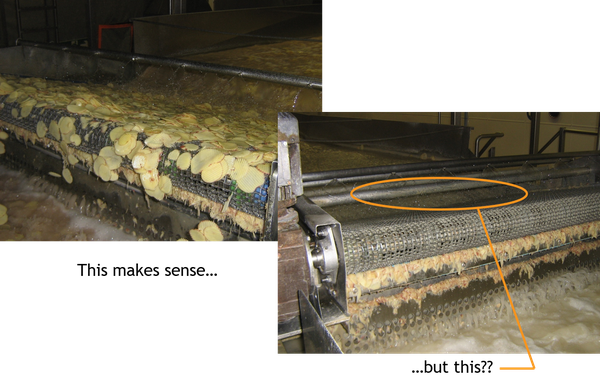
-Saving water can take many different forms. Not only are there obvious ways to save water, like simply fixing leaks or not letting water run if it isn't needed, but sometimes finding a new way to perform a task, like the way water is used to separate potato slices, can result in huge savings. Watch this video to learn about one way PepsiCo is using innovation to save water and how it's helping to meet conservation goals.
-
Discuss: Plans for Avoiding and Reducing Water Use
-From the previous activities you have a much better idea of all the ways that water is directly and indirectly used. Let's put that newfound knowledge to use.
In the discussion box below, identify at least two places in your plant where you can avoid or reduce water use and generate at least three rough ideas for how to do this.
Once you have made a post, read through the ideas from your colleagues. Try to build on their ideas to develop concrete methods to avoid or reduce water use in your plant.
-
-
Analysis
-
Activity: Water Profiler Introduction
-The profiler is a valuable, spreadsheet-based tool that is one of the single most effective ways to put things into perspective and ensure that we’re working on the correct issues for ReCon. It takes the measurements you enter, calculates them, and points you to the most impactful changes you can make to conserve resources. While it takes some time to fill out the first one, it is much easier to keep updating it every year.
- The profiler proportionally compares resource users inside the facility to identify which ones deserve our immediate attention.
- It also compares consumption from the different resource users with best-in-class performance to help evaluate the size of the prize of future improvement.
- It is a great way to see if supply matches consumption to possibly reveal if there are any metering or billing issues.
-
Activity: The Profiler
-Use the link below to download, review, and save your copy of the profiler in the correct measuring system and plant type for your country, changing the file name to include your site name and year. You will be filling it out for your site and uploading the completed profiler along with the calculation tool in order to be marked complete in this course.
Note: The generic profiler is an .xlsb file type, but Excel will still open it after you download and save it. Make sure it saves to your computer as .xlsb. The other two profilers are .xlsx and can be saved normally.
-
Watch: Entering Data into the Water Profiler
-Watch Jean-Francois Allard, Sustainability Senior Manager Global Sustainability Operations, walk you through how to enter information into the profiler. You may wish to also have your copy of the profiler open on your computer as you walk through the different sections.
Completing the profiler is one of the most important things you can do for ReCon in your plant. Below are some key points:
- The system assumes you have no meters installed.
- If you have meters and data you can fine tune the profiler.
- The more effort you put into the generation of the data the more realistic the output will be.
- It should be reviewed yearly and a good program regularly updates it.
- It is dependent on resources, plant meters, and data.
- A profiler can take one month to complete.
Fill out the profiler with an entire year’s data if at all possible. This allows the tool to smooth out any seasonal fluctuations and provide a better analysis. Some plants may have gone through some important changes and might not have a full year’s data set with the latest plant configuration. If you must use a shorter timeframe, make sure that all the data entered in the profiler is consistent with the reduced timeframe.
The first step is to gather information. Some information, such as bills and production volumes, may be easy to get; others may require the help of specific subject matter experts at your site. Work in close calibration with experts, process operators, and process specialists to get the current and real rates and parameters.
Don’t try to fill out the profiler by yourself. If you do it by yourself, you won’t be able to see the real snapshot of water use at your site, and the profiler may not deliver the intended benefits of highlighting all the potential opportunities for improvement.
-
Read and Save: How to Fill Out the Profiler
-Filling out the Profiler
Because you are filling out your first profiler as part of this class, add this page of instructions to your backpack by clicking on the backpack icon. That will make it easy to return to the instructions when you are working on your profiler.
Profiler Structure
The profiler is composed of different sections.
- Instruction tab: Contains the instructions and color-coding information to fill out the profiler
- Yellow tabs: Contain the overall plant information, including production volumes and supply
- Green tabs: Contain the lines and operational unit mappings where we input the details related to operations
- Blue tabs: Contain the plant data and the detailed user analysis
- Color-coded cells: Yellow cells are for entering data, blue and green cells calculate and populate automatically, and the orange tab and cells are where you will find some additional instruction or useful information
Plant Set Up Tab
This is where you input all the plant information, including sector, location, and the main ReCon stakeholders at the facility. Additional information needed for this tab includes the line capacity and through efficiency. Enter data in yellow cells only – the blue cells will populate with information entered in other tabs.
Production Data
Enter the manufacturing volumes for every line at the site. Each row is for a distinct production line and contains information such as product type, line name, production volume, etc.
Incoming Water
Enter information on all the water supplies of your facility. Include incoming water from the city, wells, rain, etc. Also enter data on all the different wastewater effluents.
Line Mapping
All the production line mapping tabs are built the same way. They are composed of two main sections: At the top is a water user summary table, and below are the other sections dedicated to the production line details. This is where you input the information regarding the running parameters, such as equipment type, consumption type, water sources. Toward the right, input information on the best-in-class performance of your sector. Since best-in-class data is country-related, the performance could be variable. Consult your ReCon sector leads to get more detail.
Utilities
Similar to the other mapping tabs, enter the running parameters and the consumption of the different utilities such as boilers, cooling towers, and chillers. As in the other tabs, there is a summary at the top of the page followed by separate sections covering each of the utilities. Another section at the bottom is where to enter any other water consumed, such as for offices, labs, and locker rooms.
Output tabs
Once all the yellow and green tabs are filled, it’s time to check the output tabs.
The Water Balance tab provides an overview of where water is consumed at the plant. It displays an accuracy figure. Any profiler with an accuracy of 95% or better is considered reliable. There is also a table with the water users and the users’ percentage. There is also a series of opportunities listed throughout the water mapping tabs.
The Output – Tier 1&2 tab contains critical and detailed information with a breakdown of different water users inside the plant and graphs of potential areas of opportunity. This identifies where the largest amount is consumed and compares your plant with best-in-class operation, showing you where to put your ReCon efforts first.
-
Complete: Reminder
-The profiler needs to be updated once a year. Take some time now to set an annual recurring calendar reminder to do this. Once you complete your first profiler in this course, you only need to update it going forward.
-
Discuss: Gathering Data
-You've learned about the calculation tool and the profiler, which are ways of using data to determine what your plant is using and how to improve. If the data you've gathered reveals some needed action items, what barriers would you face in completing those and how would you overcome them?
-
Complete Your Profiler and Calculation Tool / Finishing Up
-
Complete and Upload Profiler
-
Submit: Time to Complete and Upload Your Profiler and Calculation Tool
-Use the next few weeks to work on and complete your Profiler.
Once you have completed your profiler and calculation tool, upload those by clicking Add New File below.
Please also add a document or short video explaining what went well for you in completing these documents and why.
-
-
Blackout Date
-
Capstone
-
Attend: Capstone Call
-Agenda:
- Group discussion of best practices, successes with completing the profiler
- Group discussion of next steps - what do you want to learn next?
-
- Recommended for: Process Improvement Engineer (PIE) and engineering/project managers
- Required for: ReCon regional leaders, ReCon site leaders
- Pre-requisites to take this course: ReCon program basics
- This course is a Pre-requisite for these courses: All other ReCon water related courses such as water treatment, steam systems, etc.
This course will not be offered for the remainder of 2022 at this time. Register here for our current course offerings (at least a week prior to the start of the course). Please keep in mind your schedule and time commitment required prior to registration.