Closed Enrollment
Published Course
ReCon GHG Fundamentals for Food Manufacturing
ReCon GHG Fundamentals for Food Manufacturing
Course Created in Partnership with:
About this Course
ReCon GHG Fundamentals is targeted to ReCon regional leaders, ReCon site leaders, Process Improvement Engineers and sustainability engineer/project managers. As one of the world's leading food and beverage companies, we're committed to doing our part to curb climate change by reducing GHG emissions across our value chain. In this class you will learn the basics of GHGs and why this is important to PepsiCo. The impact of energy reduction measures will be illustrated and GHG sources calculations demonstrated. Several simple but effective GHG emission reduction tactics will be also shared. Finally, several ReCon tools such as a simplified GHG emission calculator, the Global Sustainability Dashboard as well as a Plant Energy Profiler will be explained. All these tools will help ReCon leaders better identify opportunities, which will support the company’s climate prioritization efforts.
What You Will Learn
- What is GHG
- The differences between scope 1, 2 and 3 GHG.
- How to calculate GHG emissions for your site
- How to compare your site with others
- Simple but still impactful actions to reduce GHG emission
- How to establish plant priorities
Course Overview
7 Lessons
29 Activities
3 Discussions
3 Live Events
Welcome
-
Welcome and Introduction
-
Attend: Kick-off Call
-
Join this kickoff call to learn about:
- Introduction to the CorpU platform and how it works
- Overview of this sprint and how it fits into the stages long term
- Description of final assignment
-
Read: Welcome to Fundamentals
-Welcome to ReCon Fundamentals. ReCon Program Basics introduced you to the ReCon world, the Basic Recipe, performance tracking, employee engagement, and completing the Maturity Document for resource use at your plant. Fundamentals is one of several courses that will take you through the steps in ReCon mastery.
In Fundamentals, you'll take a much closer look at how energy is used in your plant, where it comes from, what you can do for sustainability, how you can decrease use, and the many reasons why energy conservation is so important. You'll watch some fun videos and learn about Greenhouse Gas Emissions. You will complete the GHG Calculation tool, which shows the level of emissions your site is generating, and the Energy Profiler, a critical spreadsheet that helps visualize how much and where energy is consumed. This will help you determine areas of focus and select the conservation actions with the biggest impact.
-
Watch: Bold Climate Change Goal
-The next 10 years will be critical when it comes to slowing down the rate of global warming. Watch this video to hear Jim Andrew, Chief Sustainability Officer, explain how PepsiCo's goals are something we all can be proud of.
-
Complete or Update: Your Profile
-If you haven't previously, please take a few minutes to upload your picture and bio so everyone can start getting to know you. Make sure you include your current role, plant, and any hobbies. It's time to get creative.
If you completed your profile earlier, take a quick look and see if there is anything you'd like to update.
-
ReCon GHG Fundamentals for Food Manufacturing
-
Introduction
-
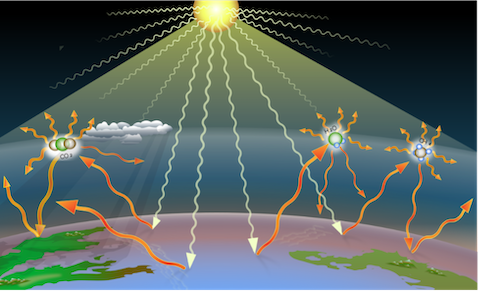
Watch: How Greenhouse Gasses Work
-Watch this video until timestamp 2:43 to learn more about how GHGs work.
-
Reflect: Carbon Footprint Calculator
-Complete the Carbon Footprint Calculator. When you've completed it (it will open in a new window), return to this page. Take a moment and jot down your results and what you discovered along the way.
-
Watch: Climate 101
-Watch this video as science educator Bill Nye explains the basics of climate change.
-
Activity: PepsiCo ESG Topics Climate Change
-This internal website provides background and information on PepsiCo programs. Once you've reviewed this information, return to this page and mark yourself complete.
ESG stands for Environmental, Social and Governance.
-
Explore and Reflect: Global Historic Emissions
-Explore the following website to see how your country has performed: Historical GHG Emissions.
GHG emissions which cause climate change have increased 50 fold since the mid-1800s. Energy makes up nearly three-quarters of global emissions, followed by agriculture. Breaking down the energy sector into its sub-sectors, electricity and heat generation make up the largest portion of emissions, followed by transportation and manufacturing. 64% of GHG emissions come from just 10 countries, while the 100 least-emitting contributed less than 3%. (Source: climatewatchdata.org)
Use the Sector/Sub-Sector dropdown to further break down the data into categories such as Agriculture, Industrial Processes, and Waste.
Reflect on how your country has performed in relation to other countries. Where does your country rank? Any surprises? Type your notes in the box below.
-
Watch: Sustainability Dashboards
-Most PepsiCo sites and sectors, have a sustainability dashboard that shows progress against pep+ targets. Information is either inputted manually, pulled directly from MyEHS or another digital source.
Sector based information is used across PepsiCo to assess sector performance, compare sites, and contribute to our external reporting initiatives. Therefore, the plant data must be as timely and as accurate as possible.
The video is an example of a sustainability dashboard on tableau. The data was pulled from MyEHS. This dashboard is no longer updated or in use, however, it is a good example of how information was relayed to the rest of the business.
Do you have a sustainability dashboard at your plant displaying either site based performance or the overall performance of the Sector?
-
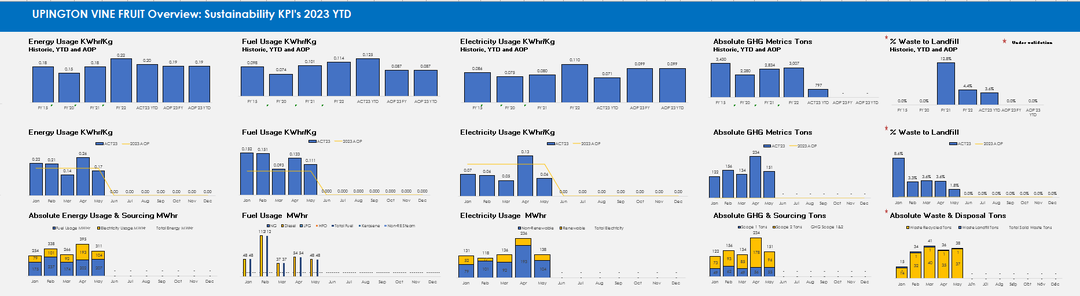
Watch: Sustainability – Energy
-Looking at the example below, you can see energy performance throughout the year, against the previous year, and against baseline for the Upington Vine Fruit Plant. When creating an energy scorecard for your site, be sure to display all of this information so that the trends can be seen clearly for anyone viewing the information.
Please note: The video link is no longer available as it previously referred to the tableau Sustainability Dashboard which is not operational.

-
Watch: Sustainability – Intensity Dashboard and Map Dashboard Tabs
-In this video, Albert takes a look at the Intensity Dashboard and Map Dashboard tabs. Whilst the dashboard is no longer operational, the video gives you a good insight of how information can be relayed on a digital dashboard.
-
Discuss: GHG Costs
-You've watched and read quite a bit of information about GHGs today, and now it's time to think about how this relates to PepsiCo. In addition to energy costs (such as gas and electricity), in what other ways do GHGs cost PepsiCo money?
Review and respond to other ideas in the discussion.
-
-
Actions to Reduce Emissions
-
Watch: Circular Economy
-This video explains the circular economy and how society can rethink our linear way of doing things.
-
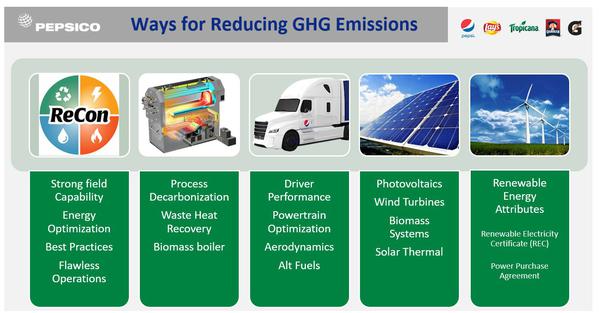
Activity: Ways to Reduce GHG Emissions
-What can you do to reduce GHG Emissions? In the graphic below are some ideas, such as actively participating in the ReCon program, looking at your equipment, green energy sources such as solar or wind, and looking into Renewable Electricity Certificates or Power Purchase Agreements.
-
Watch: Using the GHG Calculation Tool
-Watch this video by Jean-François Allard, Sustainability Senior Manager, Global Sustainability Operations, to see a demonstration of the GHG Calculation tool, available here and attached below. This is a simplified GHG Calculator, focusing on the most important direct and indirect emissions from a manufacturing site. Save the calculators as an .xlsx file type.
Instructions
Direct Emissions:
- Enter annual data for each combustion unit (by fuel type) in ORANGE cells in Table 1. An example of entry is shown in first row (GREEN Italics).
- Enter Source ID and description.
- Select "Fuel Combusted" from drop down menu.
- Enter "Quantity Combusted" in appropriate units.
- Emissions factors used for the calculations can be found in Table 2.
- The emission factor column in Table 1 is unlocked in case you would like to use a different one.
Indirect Emissions:
- Enter annual data for electrical meter in GREEN cells in Table 1. An example of entry is shown in first row (BLUE Italics).
- Enter Source ID and description.
- Select "Region" from drop down menu.
- Enter "Electricity purchased" in appropriate units.
- Enter purchased steam annual data in ORANGE cells in Table 2. An example of entry is shown in first row (GREEN Italics).
- Enter Source ID and description.
- Select "Fuel Combusted" from drop down menu.
- Enter "Quantity Combusted" in appropriate units.
- Emissions factors used for the calculations can be found in Table 3.
- The emission factor column in tables 1 and 2 are unlocked in case you would like to use a different one.
-
Read: Avoid and Reduce Energy Use
- The easiest way to minimize GHG emissions is to avoid using energy in the first place whenever possible. Below are some suggestions to avoid and reduce energy use. How many of these ideas can you implement in your plants?
Some common best practices don't require significant investment and could immediately have an impact on energy consumption.
Ways to avoid energy usage:
- Implement a solid leak detection and remediation program – steam, condensate, air, and nitrogen leaks are still an important opportunity for many sites.

- Implement effective line start-up and shut-down procedures. (Idling equipment requires unnecessary use of resources.)
- Establish off-production protocol to maximize utilities generation efficiency (steam, cooling water, compressed air, and nitrogen). Unnecessary equipment may be idling during these periods.
- Ensure that every hot surface such as steam and condensate pipes are insulated. This helps with reducing losses and it makes the working environment safer. Assess regularly and repair equipment insulation (internal and external) when needed.
- Avoid using compressed air wherever possible.
- Eliminate inappropriate uses of compressed air such as personal cooling and component cooling (motor, shaft, and bearing).
- Avoid using very inefficient components such as air motors, air vibrators, or diaphragm pump. Their electrical counterparts are at least seven times more efficient.
- Use brooms, scrapers, and squeegees instead of air hoses during cleaning.
Ways to reduce energy usage:
- Run the production line according to recommended specifications. Too many plants throttle down their production rate which has a significant impact on the energy use.
- Minimize line shut-down and start-up.
- Reduce finished product waste.
- Procure and use a high efficiency motor and gearbox.
- Ensure that every compressed air blow is correctly controlled, such as ensuring that a nozzle is present and in good shape.
- Install motion sensors to control lighting.
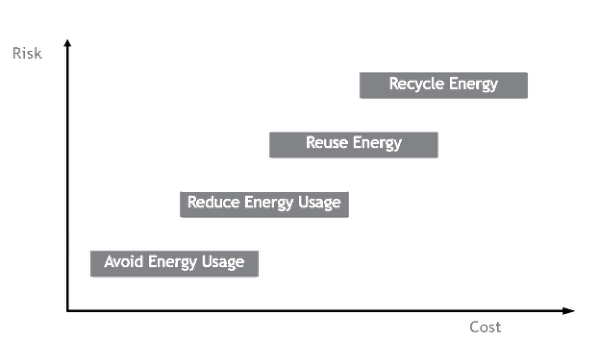
As you determine the actions you can take to avoid and reduce energy use, keep the Cost vs. Risk Hierarchy (below) in mind and begin with the low cost/low risk opportunities. In addition, refer to the Road to Great Performance for tactics.
- Implement a solid leak detection and remediation program – steam, condensate, air, and nitrogen leaks are still an important opportunity for many sites.
-
Watch: ReCon Tactics for Saving Energy
-Did you know that when you waste a finished product, you are also wasting everything that went into the product?
All our products have GHG embedded in them, including:
- Packaging material – plastic, paper bags, and the raw materials used to create them
- The energy used to create the ingredients
- Transportation to get everything to your plant
What other things can you think of that would be wasted?
In this short video, we present some simple tactics that you can use in your plant immediately to conserve energy.
-
Discuss: Plans for Avoiding and Reducing Energy Use
-For this discussion, identify at least two places in your plant where you can avoid or reduce energy use and how you will accomplish that reduction.
Collaborate with your colleagues to build on their ideas and suggest additional ways to reduce or avoid energy use.
-
Read: Other Ways to Reduce GHG Emissions
-Below are multiple ways that GHG emissions can be reduced. While some methods may require approvals and capital expenditures, it's important to be aware of all options available.
ReCon is the first approach to reducing GHG emissions. It involves a strong field capability of implementing best practices for energy optimization. The flawless execution of the ReCon techniques results in a best-in-class plant.
Process decarbonization, waste heat recovery, and biomass boilers are additional ways plants can reduce GHG emissions.
When possible, there are also improvements we can make with our fleets. Driver performance can be improved to lessen GHGs. Powertrain optimization, aerodynamic improvements, and alternative fuels are also options.
To lessen the GHGs we use for the energy used in our plants, we can look to photovoltaics (the conversion from light to energy at the atomic level), wind turbines, biomass systems, and solar thermal energy.
Additional options include renewable energy attributes, such as renewable electricity certificates (RECs) and power purchase agreements.
 With that being said, here are the changes that can make the most impact in reducing our GHG emissions:
- Minimize finished product waste
- Increase true efficiency (TE)
- Maintain a great combustion efficiency on your largest burners (>80%)
- Increase and maintain a great steam condensate return rate (>90%)
- Heat recovery projects
- Electrification (water heating, space heating, etc.)
The pie chart on the left below shows the energy used globally, and the one on the right shows the GHG emissions, also globally. In both cases, manufacturing fuel is the largest section.
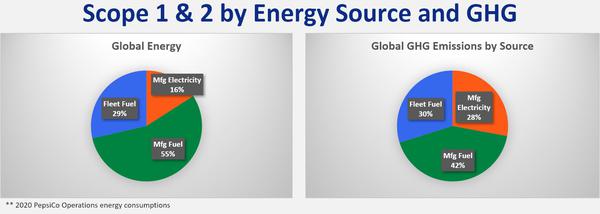
The fuel we use in manufacturing is the largest generator of GHG emissions. As we move to more and more renewable energy in the future, its impact will continue to increase. Going forward over the next few years, the focus in plants should be optimizing our processes to minimize fuel consumption. Combustion efficiency, condensate return rate, heat recovery, and electrification are topics covered in great detail in other ReCon training modules that we recommend you take in the future. In the meantime, it will be important for you to focus on the low-cost but impactful tactics that we're presenting in this course.
-
-
Analysis
-
Activity: Energy Profiler Introduction
-The profiler is a valuable, spreadsheet-based tool that is one of the single most effective ways to put things into perspective and ensure that we’re working on the correct issues for ReCon. It takes the measurements you enter, calculates them, and points you to the most impactful changes you can make to conserve resources. While it takes some time to fill out the first one, it is much easier to then keep it updated every year.
- The profiler proportionally compares resource users inside the facility to identify which ones deserve our immediate attention — the critical few with the largest impact.
- It also compares consumption from the different resource users with best-in-class performance to help evaluate the size of the prize of future improvement.
- It is a great way to see if supply matches consumption to possibly reveal if there are any metering or billing issues.
-
Activity: The Energy Profiler
-Use the link below to download, review, and save your copy of the profiler for the correct plant type and measuring system for your country, changing the file name to include your site name and year. You will be filling it out for your site and uploading the completed profiler and calculation tool in order to be marked complete for this course.
Note: The generic profiler is an .xlsb file type, but Excel will still open it after you download and save it. Make sure it saves to your computer as .xlsb. The other two profilers are .xlsx and can be saved normally.
-
Watch: Using the Energy Profiler
-Watch as Hassaan Zafar, Sustainability Manager from Pakistan, walks you through how to enter information into the profiler. You may wish to also have your copy of the profiler open on your computer as you walk through the different sections.
Completing the profiler is one of the most important things you can do for ReCon in your plant. Below are some key points:
- The system assumes you have no meters installed.
- If you have meters and data you can fine tune the profiler.
- The more effort you put into the generation of the data the more realistic the output will be.
- It should be reviewed yearly and a good program regularly updates it.
- It's dependent on resource, plant meters, and data.
- A profiler can take one month to complete.
Complete the profiler with an entire year’s data if at all possible. This allows the tool to smooth out any seasonality and provide a better analysis. Some plants may have gone through some important changes and might not have a full year’s data set with the latest plant configuration. If you must use a shorter timeframe, make sure that all the data entered in the profiler is consistent with the reduced timeframe.
The first step is to gather information. Some information, such as bills and production volumes, may be easy to get, others may require the help of specific subject matter experts at your site. Work in close collaboration with experts, process operators, and process specialists to get the current and real rates and parameters.
Don’t try to complete the profiler by yourself. If you do, you won’t be able to see the real snapshot of use at your site and the profiler won’t deliver the intended benefits or highlight all the potential opportunities for improvement.
-
Read: How to Complete the Profiler
-Completing the Profiler
Because you are completing your first profiler as part of this class, save this page of instructions to your backpack by clicking on the backpack icon.Profiler Structure
The profiler is composed of different sections which are color-coded.
• Yellow Tabs/Cells: Require/Contain User Inputs
• Blue Tabs/Cells: Contain Calculated Values/Outputs
• Green Tabs/Cells: Contain BIC & Opportunities Values/Outputs
• Purple Tabs/Cells: Contain Projects Values/Outputs
• Orange Tabs: Contain Helpful Information/Calculators
Introduction
This is where you input all the plant information, including site, your email, date, the main ReCon stakeholders at the facility, and currency information. Enter data in yellow cells only – the blue cells will populate with information entered in other tabs.Production
Enter the manufacturing volumes for the site over time.Energy Purchases
Enter information on all the energy supplies of your facility. Include renewable and non-renewable electricity, natural gas, fuel oil, and propane.Remaining Yellow Tabs
The remaining yellow tabs ask for details about the various energy users in the plant, and some are broken down by production line.Output Tabs
Once all the input tabs are completed, it’s time to check the output tabs, which contain charts and tables with details about your plant’s energy use. Find out what percentage of energy consumption originates from different sources and, most importantly, compare your use to best practices to see where your opportunities lie for energy conservation and the reduction of greenhouse gases. This is your guidance for where to focus your efforts to achieve the greatest results. Sure, changing lightbulbs to LEDs can help, but it’s a drop in the bucket compared to improving the efficiency of the big energy users in your plant. -
Complete: Reminder
-The expectation is that the profiler be updated once a year. Take some time now to set an annual recurring calendar reminder to do this. Once you complete your first profiler in this course, you only need to update it going forward.
-
Discuss: Gathering Data
-You've learned about the calculation tool and the profiler, which are ways of using data to determine how much energy your plant is using and how to improve. If the data you've gathered reveals some needed action items, what barriers would you face in completing those and how would you overcome them?
-
Complete Your Profiler and Calculation Tool / Finishing Up
-
Office Hours
-
Attend: Office Hours
-Time and date are TBD
Agenda:
- Check in on profiler progress
- Answer any questions
- Review highlights of the discussions
- Provide instructions on uploading the profiler and video/document prior to the final call
-
-
Uploading Documents
-
Submit: Upload Your Profiler and Calculation Tool
-Now that you have completed your profiler and calculation tool, it's time to upload those by clicking Add New File below.
Please also add a document or short video explaining what went well for you in completing these documents and why.
-
-
Capstone
-
Attend: Capstone Call
-Time and date TBD/
Agenda:
- Best of the best videos
- Interview with selected participants
- Group discussion of best practices, successes with completing the profiler
- Group discussion of next steps - what do you want to learn next?
-
- Recommended for: Process Improvement Engineer (PIE) and engineering/project managers
- Required for: ReCon regional leaders, ReCon site leaders
- Pre-requisites to take this course: ReCon program basics
- This course is a Pre-requisite for these courses: All other ReCon energy-related courses such as compressed air systems, motor and drive, etc.
For 2022, this course will be offered starting October 10, 2022. Register here at least a week prior to the start of the course. Please keep in mind your schedule and time commitment required prior to registration.